1 基于4种社交网络和A/H1N1的LHBM模型的建立
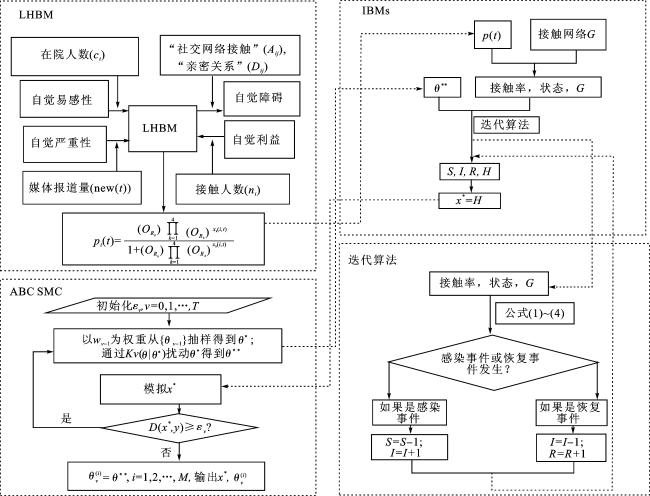
图2 基于4种社交网络的LHBM、IBMs与ABC SMC方法相结合的流程图Fig.2 The scheme of the LHBM and IBMs combining with ABC SMC methods based on social networks |
表1 在4种经典的社交网络结构下,模型所有未知参数的均值和标准差的取值范围及其估计值Tab.1 The ranges and the reasonable estimated values of means and standard deviations for all unknown parameters of model with different social networks |
| 参数均值(μ) | 最小值 | 最大值 | 估计值(规则) | 估计值(WS) | 估计值(NW) | 估计值(随机) |
|---|---|---|---|---|---|---|
| δ | 0.35 | 0.58 | 0.410 7 | 0.475 1 | 0.580 0 | 0.475 0 |
| λ | 170 | 195 | 175.116 8 | 175.402 1 | 174.175 0 | 173.485 0 |
| τ | 6 | 8 | 6.716 4 | 6.898 6 | 6.895 5 | 6.510 9 |
| ξ | 10 | 50 | 18.781 0 | 21.449 0 | 20.966 4 | 10.047 5 |
| η | 0.3 | 0.6 | 0.599 5 | 0.482 2 | 0.513 3 | 0.414 5 |
| -0.75 | -0.6 | -0.637 3 | -0.710 2 | -0.163 6 | -0.631 7 | |
| 0.001 | 0.1 | 0.009 3 | 0.015 8 | 0.059 0 | 0.048 4 | |
| 0.65 | 1 | 0.717 0 | 0.846 3 | 0.999 3 | 0.759 6 | |
| 0.01 | 0.15 | 0.065 4 | 0.092 3 | 0.149 8 | 0.084 0 | |
| -0.75 | -0.45 | -0.504 5 | -0.579 9 | -0.497 2 | -0.520 9 | |
| 参数标准差(σ) | 最小值 | 最大值 | 估计值(规则) | 估计值(WS) | 估计值(NW) | 估计值(随机) |
| δ | 0.01 | 0.1 | 0.038 1 | 0.058 3 | 0.094 0 | 0.046 7 |
| λ | 1 | 5 | 3.591 6 | 3.837 8 | 4.458 9 | 3.144 4 |
| τ | 0 | 2 | 0.175 5 | 0.800 1 | 1.129 9 | 0.199 7 |
| ξ | 2 | 2 | 2.000 0 | 2.000 0 | 2.000 0 | 2.000 0 |
| η | 0.1 | 0.1 | 0.100 0 | 0.100 0 | 0.100 0 | 0.100 0 |
| 0.2 | 0.6 | 0.293 9 | 0.388 3 | 0.210 9 | 0.396 7 | |
| 0.01 | 0.4 | 0.343 0 | 0.306 9 | 0.200 7 | 0.010 0 | |
| 0.3 | 0.5 | 0.316 3 | 0.490 3 | 0.427 8 | 0.342 1 | |
| 0.01 | 0.1 | 0.030 2 | 0.054 3 | 0.094 2 | 0.050 3 | |
| 0.1 | 0.5 | 0.100 4 | 0.401 6 | 0.499 0 | 0.141 7 | |
| 残差绝对值的和 | 2.314 2×10³ | 2.785 7×10³ | 2.510 8×10³ | 2.403 1×10³ |
注:WS为Watts and Strogats; NW为Newman and Watts。 |
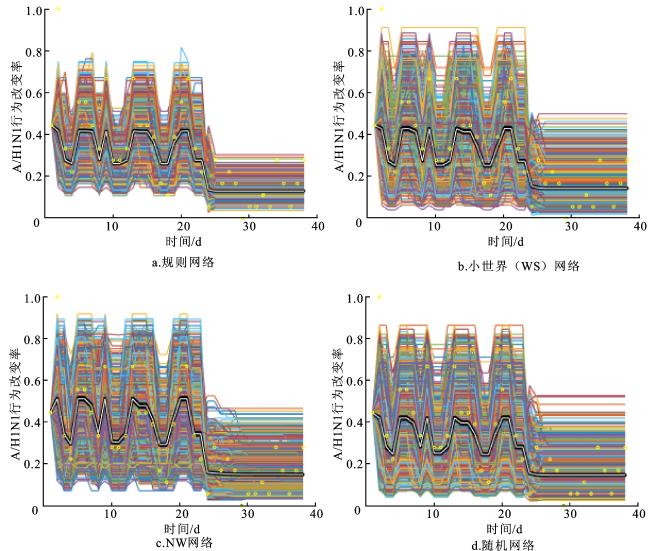
图3 基于2009年陕西省A/H1N1的报告病例数及与之相关的媒体报道量,对模型中2 004个个体的个体行为变化率pi(t)进行估计注:网络版为彩图。每个子图中的亮曲线和黑色区域分别代表2 004个个体的平均行为改变率(即 (t)及其95%的置信区间),小圆圈代表p(t)的真实值。 Fig.3 The estimation of individual behavior change rate pi(t) for 2 004 persons based on the reported cases and news items related to the A/H1N1 for model during 2009 in Shaanxi Province |
2 基于ABC SMC方法的IBMs参数估计与模型拟合
2.1 基于社交网络的IBMs的建立
2.2 IBMs参数估计与模型拟合
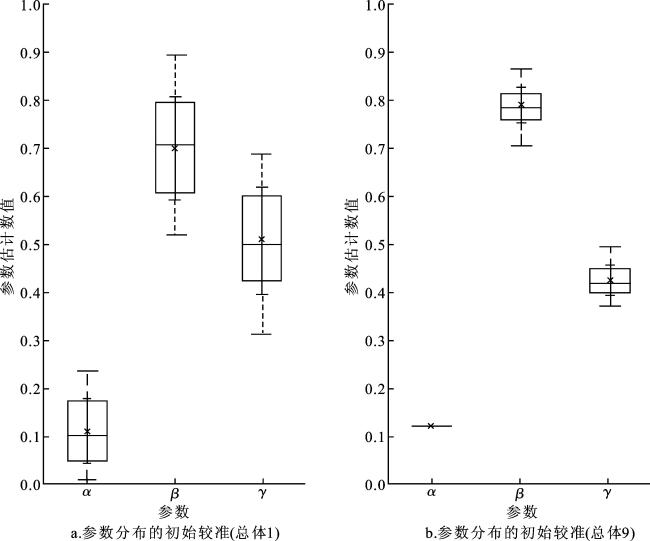
图4 参数α、β、γ的分布注:网络版为彩图。星号表示中位数,绿线部分表示95%置信区间。方框图包括最大值、上四分位、中位数、下四分位和最小值。 Fig.4 Distributions of parameter α,β and γ |
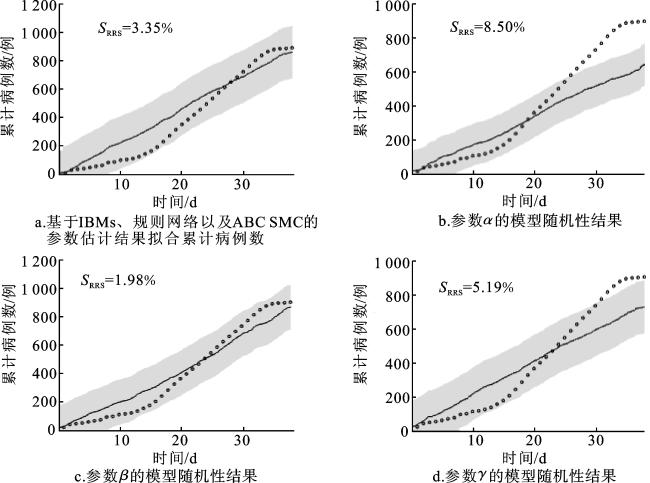
图5 基于IBMs、规则网络以及ABC SMC的参数估计结果拟合累计病例数及参数α、β、γ的模型随机性结果注:黑圈是观测数据,黑线是平均值,阴影区域是总体9的100次模拟结果的均值±标准差。 Fig.5 Fits of IBMs with regular networks for the number of accumulated infected individuals based on the parameter values of ABC parameter estimation and the stochastic results of model of the parameter α,β,γ |